
Spain is one of the most popular countries for Expats. It boasts great weather, a fantastic lifestyle, and delicious food. It’s becoming increasingly popular for people from the UK and the US, with these countries making up almost a third of Spain’s Expat population in 2023.
While people usually ask how to move to Spain from the US or the UK, we want to tell you why you should move. Around 80% of our clients come from the US or the UK, so we wanted to compare life in these three countries. We’ve collected data across a wide range of factors, including life expectancy, average salary, cost of living, and more, to reveal whether Spain, the US, or the UK is the best country to live in.
Spain is the best country to live in compared to the UK and the US, with a livability score of 9.27/10
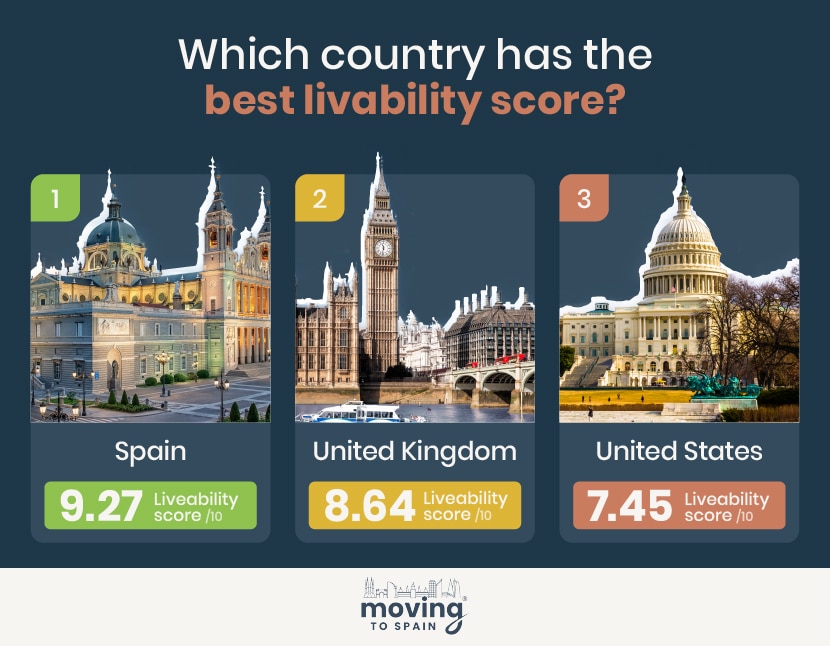
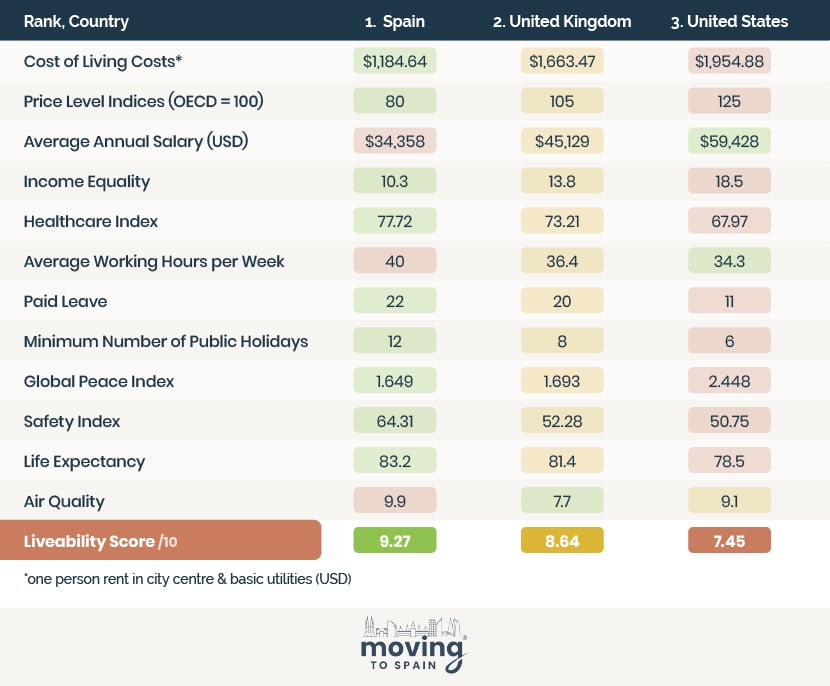
To identify the most livable country, we’ve compared 12 factors across Spain, the US, and the UK, including healthcare quality, cost of living, income levels, safety, life expectancy, and more.
- Spain – 9.27 livability score
Spain takes the top spot, with a livability score of 9.27 out of 10. Spain tops the scores for many factors, including income inequality, healthcare, cost of living, and safety. It’s a diverse, welcoming country that welcomes Expats and has a laid-back lifestyle. Spain’s education system is also excellent, emphasizing languages and critical thinking to help students apply knowledge to real-life situations.
- United Kingdom – 8.64 livability score
The United Kingdom takes second place, with a livability score of 8.64 out of 10. Despite ranking at the top for just one of our 19 factors, the UK is a consistent middle ground between the US and Spain. Compared to Spain, the UK has a high cost of living and a low safety score but boasts good air quality, 20 days of paid leave, and fewer working hours per week.
- United States – 7.45 livability score
The United States ranks third with a livability score of 7.45 out of 10. The US has the fewest average working hours per week and the highest average salary. However, the US ranks bottom for the cost of living, healthcare, and paid leave. While there is no law regarding paid family and medical leave in the private sector, many employers offer paid leave, which varies depending on how long an employee has been at the company. After one year, US employees take an average of 11 days of paid leave.
Livability Factor – Cost of Living
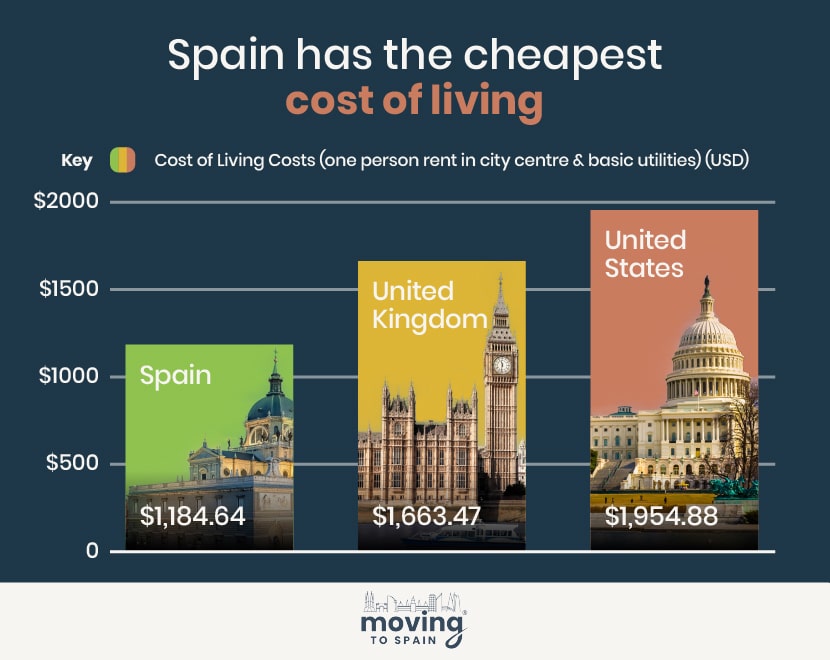
- Spain – $1,184.64 cost of living costs
Spain has the cheapest living costs, with rent for one person in the city center and essential utilities costing just over $1,000. Living costs in Spain are considerably more affordable than in the UK and the US, with rent and utilities costing almost half as much as in the US.
Livability Factor – Price Level Index
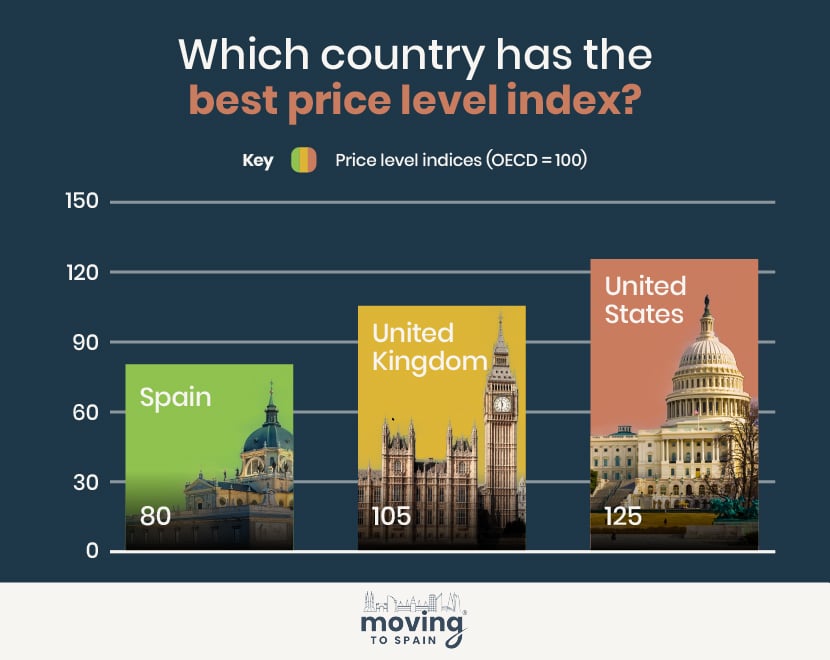
The price level index is a country’s purchasing power ratio to the market exchange rate. This ratio compares Spain, the United Kingdom, and the United States to the average rate of OECD countries.
- Spain – 80 price level index
Spain has the best price level index, 80:100, compared to OECD countries. This score of 80 suggests that specific goods are cheaper in this country than the average rate of other OECD countries.
Livability Factor – Average Annual Salary
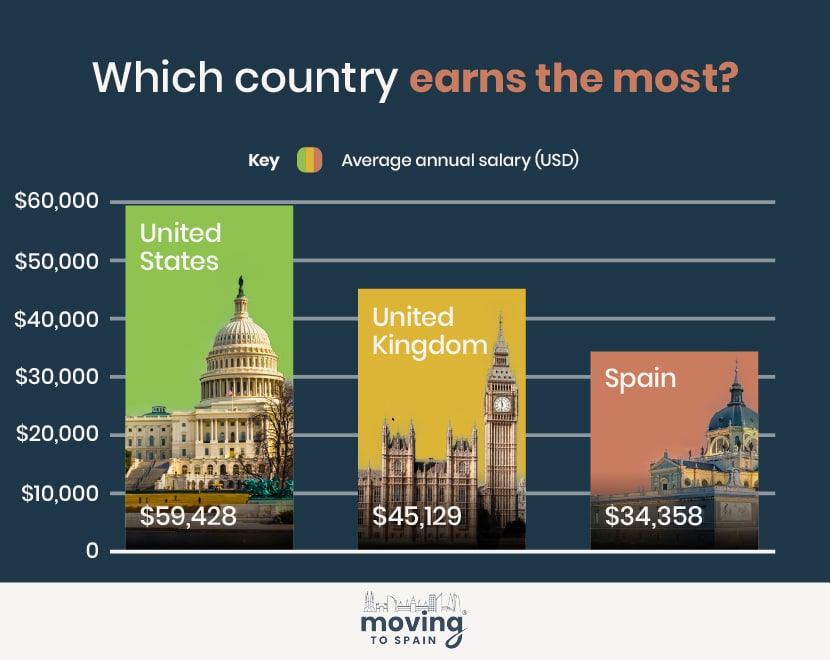
- United States – $59,428 average annual salary
The average annual salary in the US is almost $60,000, higher than in Spain and the UK. Spain’s average annual wage is less than half that of the US, at almost $35,000. However, the cost of living in the US is considerably higher than in Spain.
Livability Factor – Income Equality
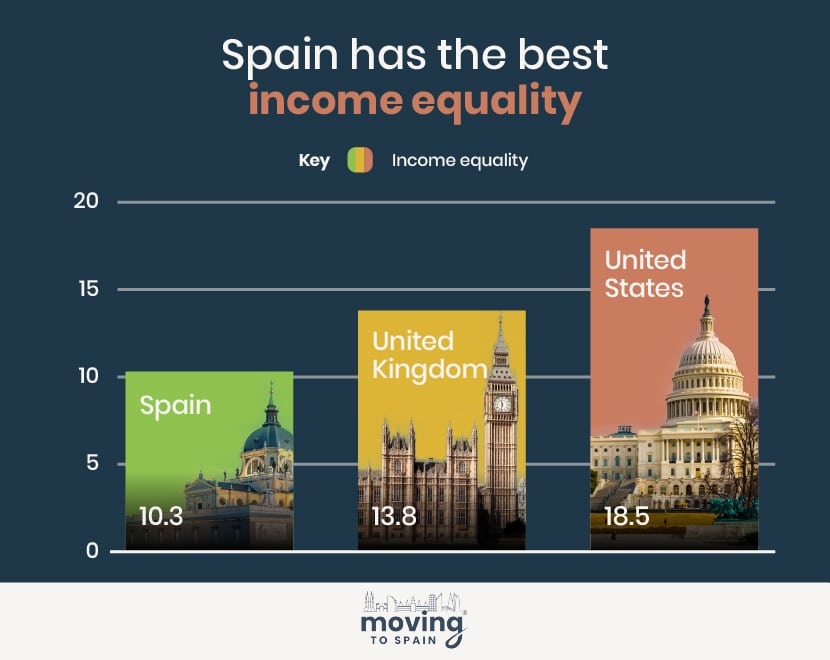
- Spain – 10.3 income equality
Spain has the best income equality, with a ratio of 10.3. This indicates that compared to the UK and the US, Spain’s richest 10% are closer to Spain’s poorest 10% in terms of income.
Livability Factor – Healthcare
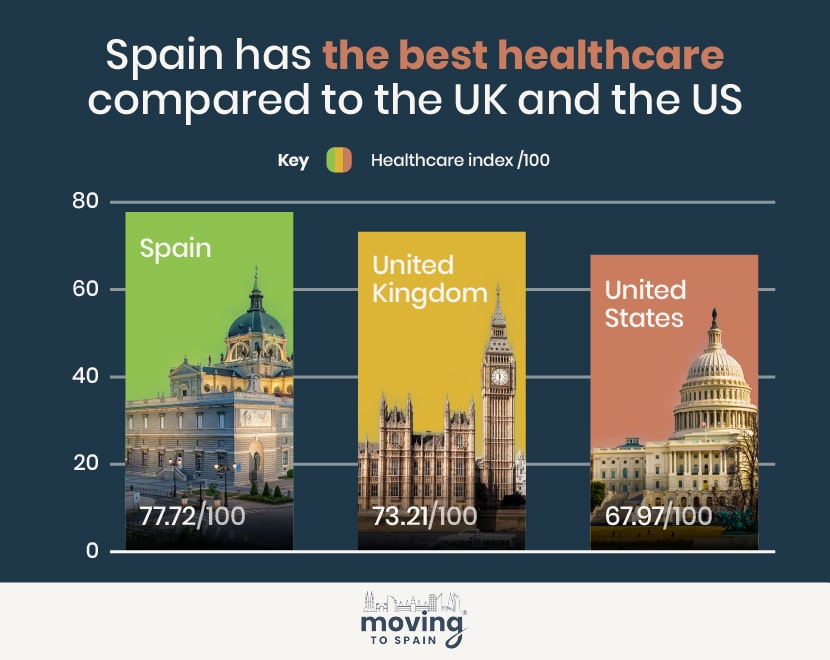
The healthcare index assesses the quality of healthcare and professions, equipment, infrastructure, services, and resources based on surveys and crowd-sourced data — using this to give a score out of 100.
- Spain – 77.72 healthcare index
Healthcare in Spain is better than in the US and the UK, with a healthcare index score of 77.72 out of 100. In Spain, citizens and residents can access universal healthcare, including Expats and short-term residents who pay social security contributions. The Sistema Nacional de Salud, or National Health System, provides free public healthcare for over 99% of the population.
Livability Factor – Working Hours
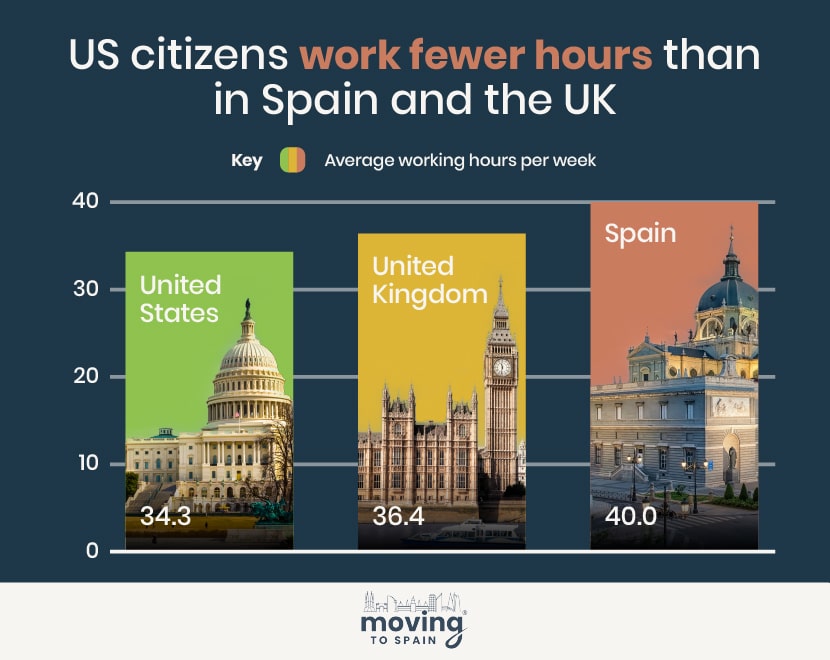
- United States – 34.3 average working hours per week
The US is top, with an average weekly working hours of 34.3. The average working hours per week has also slightly decreased in the last two years by 0.3 hours. Before dropping for five months, the average working hours peaked between April and August 2022 at 34.6 hours per week and didn’t rise again until January 2023. The lowest average working week was in January 2024, when US citizens worked 34.2 hours per week on average. Part of the reason for this fall is the increase in part-time and return workers who left their jobs during the pandemic.
Livability Factor – Paid Leave
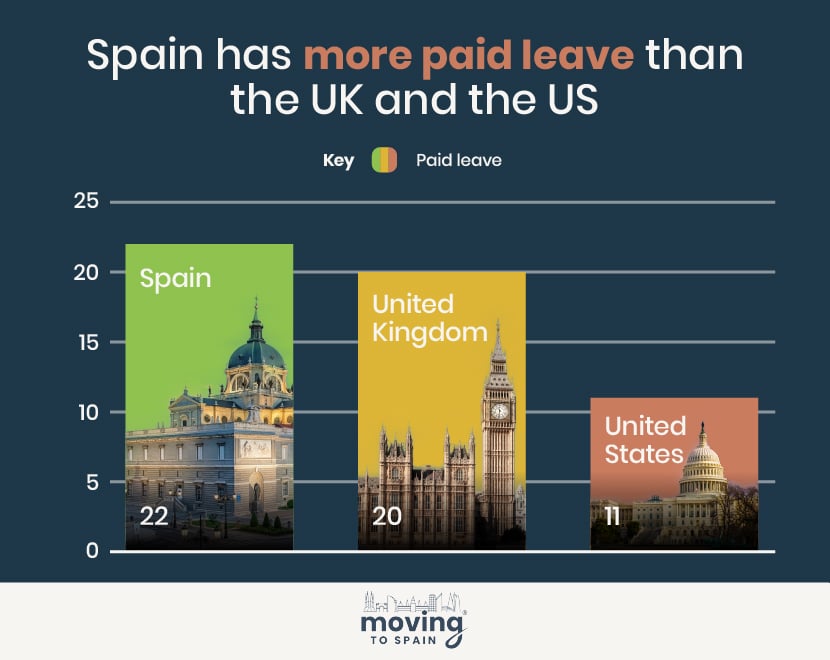
- Spain – 22 days paid leave
Spain’s minimum annual leave is higher than that in the UK and the US, with 22 days of mandatory paid vacation. The UK follows closely behind with 20 days of minimum paid vacation.
Not only is there no law in the US regarding minimum paid leave, but in places where employers offer it, employees take the fewest days off compared to Spain and the UK—just 11 days.
Livability Factor – Public Holidays
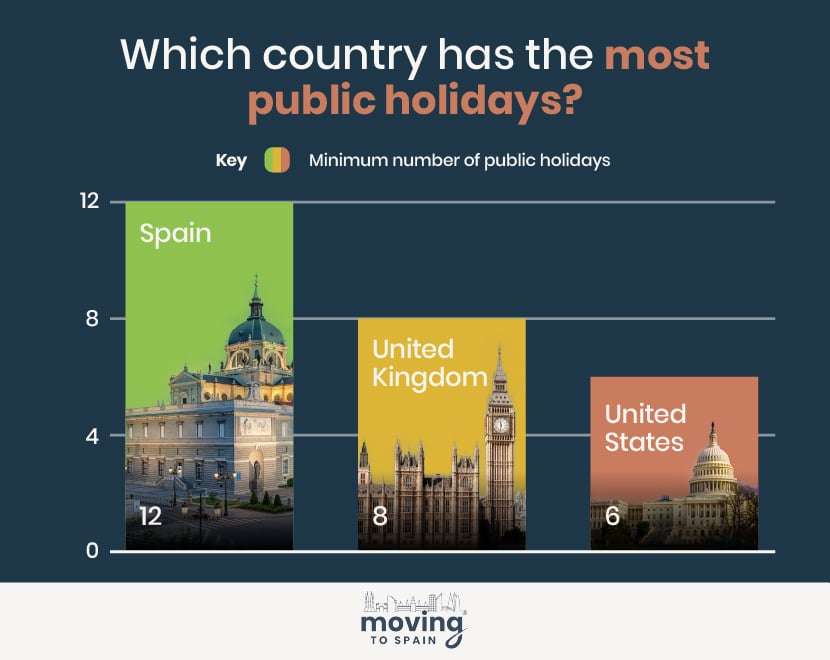
- Spain – 12 minimum public holidays per year
Again, Spain takes the top spot, with a minimum of 12 public holidays per year. Spain’s public holidays are spread relatively evenly throughout the year, with February, April, June, July, and September being the only months without a national public holiday. Depending on where you live, there are also several regional public holidays.
Livability Factor – Global Peace Index
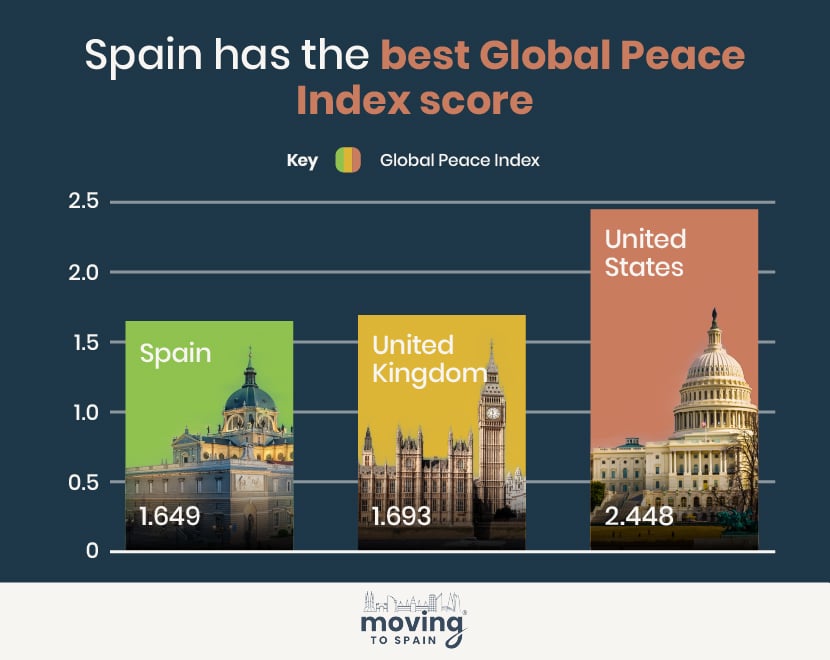
- Spain – 1.649 Global Peace Index
Spain takes the top spot with a Global Peace Index score of 1.649. Spain ranks 32nd for its Global Peace Index score compared to the rest of the world, with the UK following closely behind in 37th place. However, the US ranks 131st in the world. This index looks at criminality, political stability, international relations, and organized conflict.
Livability Factor – Safety
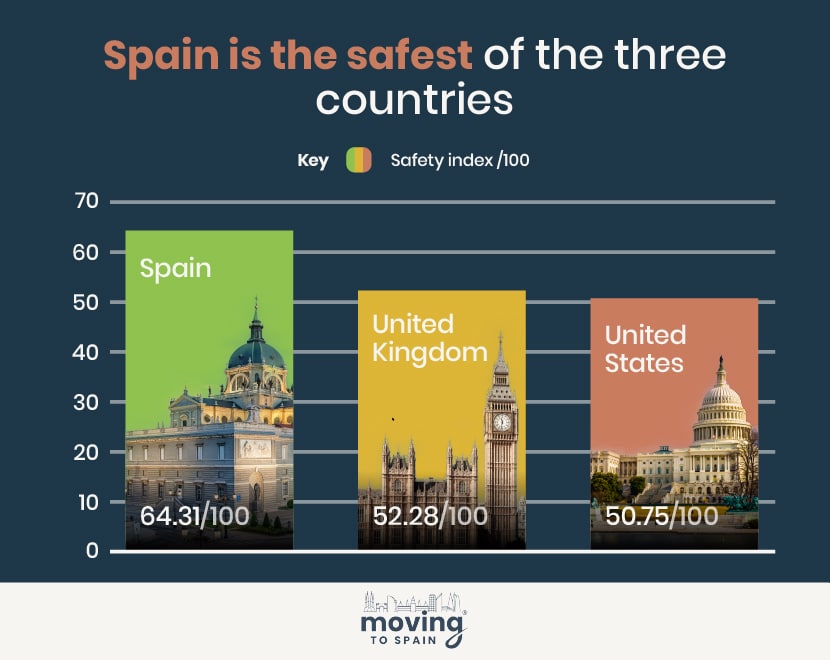
Spain is the safest country compared to the UK and the US, with a safety index of 64.31 out of 100. It is considered a very safe country, but some cities are safer than others. A study by UNESPA revealed that Albacete, San Cristobal De La Laguna, and Palencia are ranked as the safest cities in Spain, particularly regarding robberies, road safety, and fire risk.
Livability Factor – Life Expectancy
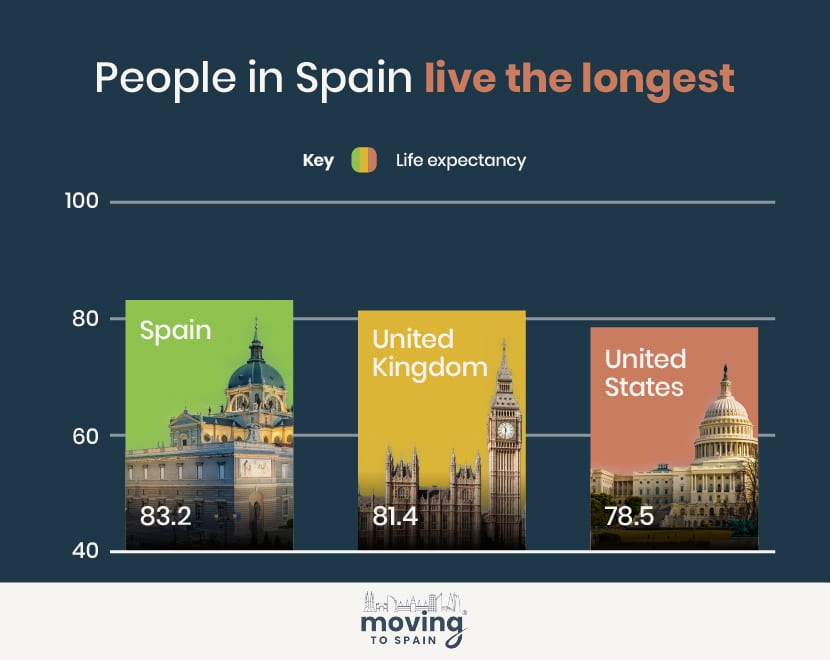
- Spain – 83.2 years life expectancy
Spain’s life expectancy is 83.2 years, higher than that of the UK and the US and one of the highest in the world. A warm climate, a Mediterranean diet, and an active and friendly lifestyle are believed to contribute to Spain’s high life expectancy. Spain is also the second-biggest producer of fruits and vegetables in the European Union.
Livability Factor – Air Quality
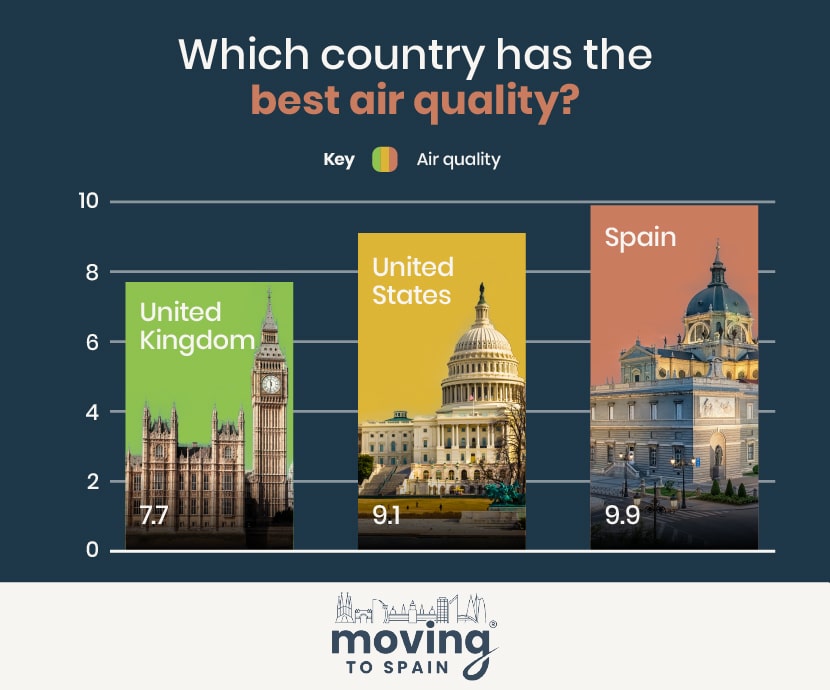
- United Kingdom – 7.7 air quality
The UK has the best air quality compared to Spain and the US, with a score of 7.7 in 2023. In South West London, Surbiton is the UK’s most polluted area, with the cleanest being Church Hill in Northern Ireland. The average PM2.5 concentration in the UK was just 1.5 times the WHO annual air quality guideline value. Interestingly, Spain’s cleanest city, El Grao de Castellon in Valencia, has better air quality than the UK’s cleanest city.
Livability Showdown: Spain vs UK vs US Methodology
- We used Numbeo to source the cost of living for Spain, the UK, and the US. For this, we combined the cost of monthly rent for one person in the city with the cost of basic utilities per month. We then used XE to convert the figures to Euros (€).
- We used OECD Data to find the price level indices for Spain, the UK, and the US and compared them to the average across OECD countries.
- We used Forbes for the US and the UK and Housing Anywhere for Spain for the average annual salary.
- We used Wikipedia to calculate Income Inequality in Spain, the US, and the UK, using the United Nations’ ratio of the poorest 10% to the wealthiest 10%.
- We used Numbeo to find the healthcare index score for each country.
- For the average weekly working hours, we used Statista for the US, Standout CV for the UK, and Blue Selection for Spain.
- For minimum paid leave, we used Wikipedia for Spain and the UK. For the US, we used the Bureau of Labor Statistics and calculated the average number of vacation days after one year in the private industry.
- We used Wikipedia to find each country’s minimum number of public holidays.
- We used Vision of Humanity for each country’s Global Peace Index scores.
- The safety index was sourced from Numbeo.
- We used the World Health Organization to find the life expectancy for each country.
- We used IQAir to find the air quality for each country.
To normalize the data, we standardized the scores based on the highest-scoring figures. We then averaged these standardized scores to get our overall livability score out of 10.